
 English
 中文
 日本語
 한국어
 العربية
 Русский
 Português
 Türkçe
 हिन्दी
 Tiếng Việt
 ไทย
 Indonesia
 Melayu
 ខ្មែរ
 ລາວ
 မြန်မာ
 Afrikaans
 Hausa
 Igbo
 Sesotho
 isiXhosa
 Yorùbá
 isiZulu
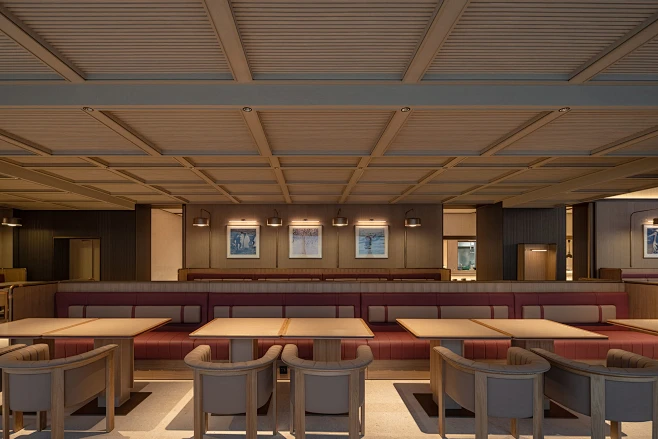
Same Space, Different Profit — Why Some Restaurants Earn 25% More
Rent is typically the largest fixed cost for any restaurant. Yet in the same 100-square-meter space, one restaurant generates $40,000 a month while another barely hits $20,000. The difference often isn’t the menu — it’s the seating layout.
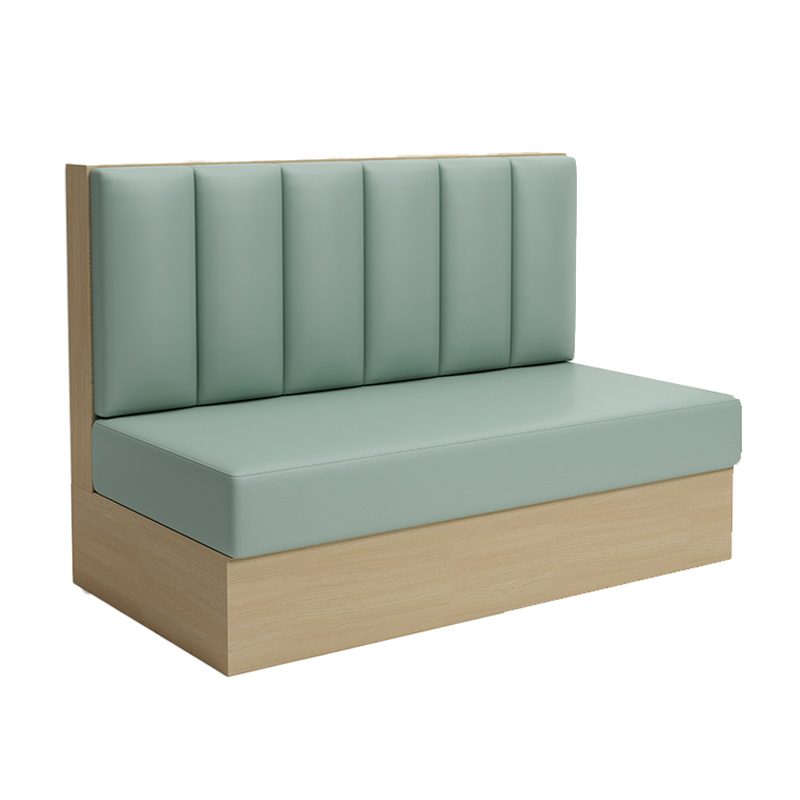
Стенд для сидения and loose tables & chairs are the two most common seating formats in commercial restaurants. Choose wrong, and you don’t just hurt the guest experience — you directly impact your revenue per square meter and table turnover rate.
This article isn’t about aesthetics. It’s about math. We’ll use real spatial data, seating density formulas, and operational scenarios to help you answer one question: Should your restaurant use more booths or more loose tables?
Part 1: The Real Math — How Much Revenue Does 1㎡ Actually Produce?
Revenue Per Square Meter Formula
Revenue per ㎡ = Monthly Revenue ÷ Floor Area
But that’s too crude. For restaurant operators, a far more useful metric is “revenue per seat-hour”:
Revenue per seat-hour = Average Check × Table Turns ÷ Operating Hours
Your seating layout directly impacts three core variables:
| Variable | Booth Impact | Loose Table Impact |
| Seats per 100㎡ | Lower (takes more space) | Higher (flexible arrangement) |
| Guest Dwell Time | Longer (privacy, comfort) | Shorter (faster pace) |
| Оборот стола | Medium to Low | Medium to High |
| Average Check | Typically Higher | Typically Lower |
Core takeaway: Booths “consume” space but “hold” higher checks. Loose tables “fit more” but generate lower per-table output. There’s no universal winner — only better or worse fits for your concept.
Part 2: Booths vs. Loose Tables — A 5-Dimension Comparison
1. Эффективность использования пространства
- Booths: Must be against walls or partitions. A standard 4-person booth occupies roughly 2.4m × 1.2m = 2.88㎡, or ~4㎡ including aisle space.
- Loose Tables: A standard 4-top is 0.8m × 0.8m, or ~2.5㎡ including chairs and shared aisle.
By the numbers: In the same 60㎡ dining area, loose tables can fit 10–12 tables (40–48 seats), while booths only accommodate 6–8 groups (24–32 seats).
2. Guest Dwell Time
- Booths: Guests stay 15–25 minutes longer on average. High backs, enclosed sides, and a sense of privacy encourage lingering.
- Loose Tables: Open environments signal “eat and go” — ideal for fast-casual and business lunches.
Operational impact: If you run a full-service or social dining concept, booths improve check averages and satisfaction. If you run fast-casual, booths will slow your turns and hurt revenue.
3. Table Turnover Difference
During a 2.5-hour lunch service:
| Тип сидения | Avg. Meal Duration | Theoretical Turns | Actual Turns (with bussing/waiting) |
| Стенды | 60 min | 2.5 turns | 1.8–2.0 turns |
| Loose Tables | 45 min | 3.3 turns | 2.2–2.5 turns |
4. Average Check Difference
- Booths: Guests pay a premium for “private space.” Data shows booth sections average 18–30% higher checks than open seating.
- Loose Tables: Better suited for standardized pricing; limited premium potential.
5. Maintenance & Operating Costs
- Booths: Upholstery is harder to clean; replacing worn sections is costly. But fixed structures reduce daily movement wear.
- Loose Tables: Individual chairs can be swapped out flexibly. However, frequent guest movement causes floor wear and noise.
Part 3: When Can Booths Actually Boost Revenue Per ㎡ by 25%?
Booths aren’t for everyone. You need to meet at least 2 of these 3 conditions for booths to be the better choice:
Condition 1: Average Check ≥ $18 (or ¥120)
Low-check concepts (fast food, noodle shops) live and die by turnover. The extra 15–25 minutes booths add to dwell time will directly eat into daily revenue.
But if you operate hot pot, BBQ, Western dining, or craft cocktail bars — where guests already plan to stay 90+ minutes — booths make them more comfortable and more likely to order extras.
Condition 2: Dinner / Social Scenes Account for > 60% of Revenue
Lunch is “efficiency dining” — loose tables win. Dinner is “social dining” — booths win.
If your sales data shows dinner driving most of your revenue, a booth-heavy layout can compensate for fewer seats through higher checks and better guest satisfaction.
Condition 3: Irregular Floor Plan or Structural Columns
Booths are the secret weapon for awkward spaces.
- Window alcove? Turn it into a “view booth” and charge a premium.
- Column in the middle? Wrap it with a booth and turn a dead zone into a semi-private nook.
- Long, narrow space? Line the walls with booths and keep the center aisle clean — far neater than scattered tables.
Real case: An 80㎡ narrow Japanese restaurant originally fit 8 loose tables (32 seats). After switching to wall-lined booths (6 groups, 24 seats), monthly revenue rose 22% despite fewer seats — thanks to higher average checks and better guest retention.
Part 4: When Are Loose Tables the Smarter Choice?
Don’t force booths if your concept matches these traits:
- Lunch revenue > 70% — Turnover is 100× more important than check size.
- Average check < $10 — Every table must flip fast to stay profitable.
- Frequent layout changes needed — Events, group bookings, seasonal themes — loose tables can be rearranged at will.
- Kitchen ticket time < 8 minutes — Fast-casual logic: the shorter guests stay, the better.
Part 5: The Hybrid Formula That Top Operators Use
The highest-revenue restaurants never go “all booth” or “all loose table.” They use precise ratios.
Golden Ratio Reference
| Тип ресторана | Booth % | Loose Table % | Layout Logic |
| Business / Date-night dining | 70% | 30% | Booths dominate; loose tables for flexible group combining |
| Family-style / Hot pot | 60% | 40% | Large booths (6–8 pax) + small loose tables (2–4 pax) |
| Casual Western / Brunch | 50% | 50% | Window booths (view premium) + central loose tables (high turnover) |
| Fast-casual / Work lunch | 20% | 80% | Few “slow zone” booths; mostly loose tables for speed |
| Bar / Nightlife | 80% | 20% | U-shaped booth enclosures + scattered high tops for roamers |
A Practical Formula
Target Revenue per ㎡ = (Booth Seats × Booth Revenue per Seat-Hour × Booth Turnover + Loose Seats × Loose Revenue per Seat-Hour × Loose Turnover) ÷ Total Area
Plug in your own average check and turnover data, and you can reverse-engineer the optimal booth-to-table ratio for your space.
Part 6: Hidden Revenue Weapons Beyond Booths and Tables
1. High-Top Tables (Bar Height)
- Occupy only ~60% of the footprint of standard tables.
- Guests subconsciously treat them as “temporary” — shorter stays.
- Ideal for waiting areas, window quick-flip zones.
- Can boost revenue per ㎡ by another 15–20% compared to standard loose tables.
2. Modular Booth Systems
- Normally: two 4-person booths.
- Combined: one 8-person banquet booth.
- Solves the classic pain point: “half-empty on weekdays, overflowing on weekends.”
3. Outdoor Folding Seating
- Deploy when weather permits; store when it doesn’t.
- “Elastic space” with zero additional rent.
Part 7: Conclusion — No Best Layout, Only Best Math
Back to the title: Booths vs. Loose Tables — which layout boosts revenue per ㎡ by 25%?
The answer is:
- If you run a higher-check, dinner-dominant, social-concept restaurant, pushing booth share above 60% — especially with premium window booths — can realistically increase revenue per ㎡ by 20–30%.
- If you run a lower-check, lunch-dominant, speed-focused concept, all loose tables + high tops is the right answer. Forcing booths in will hurt revenue.
- The safest strategy is a 70/30 or 60/40 hybrid: booths to lock in high-value guests, loose tables to protect your turnover floor.
Recommended Next Steps
- Pull your last 3 months of POS data. Break down average check and table turns by time slot and table type.
- Measure your current layout: actual seat density and aisle widths (safety standard: main aisles ≥ 1.2m, table spacing ≥ 0.5m).
- Use the formula above to model what happens to theoretical revenue per ㎡ if you shift your booth/table ratio.
- Test small: redesign one-third of your floor first, run it for 2 weeks, then decide whether to roll out fully.
Mingmeng specializes in custom commercial dining furniture. If you’re planning furniture layouts for a new restaurant or optimizing an existing space, our design team offers free layout consultation based on your floor plans and operational data.